


To coincide with London Climate Week, two powerful new digital tools have been launched to reveal England’s ‘triple jeopardy’ areas, where pollution, poverty and poor health collide.
Developed over 18 months by Natural England, the Environment Agency and academic partners, the Index of Multiple Environmental Deprivation (IMED) and the Environmental Equity Index (EEI) act like high-tech heat maps for social and environmental justice.
The IMED is the first tool of its kind, scanning the whole of England at a high-resolution, 100-metre grid level. It scores every area based on a combination of environmental pressures, including air pollution, flood risk, noise, lack of green space and the effects of climate change.
Sarah Hammonds, Urban Greening Senior Officer at Natural England suggests we think of it as ‘the environmental equivalent of the Index of Multiple Deprivation – a way of seeing, at a glance, where environmental disadvantage is greatest.’
The EEI takes this a step further by focusing specifically on towns and cities. It adds layers of data on urban heat, lack of tree cover, and public health statistics like ‘years of life lost.’ When combined with standard poverty data, this creates a picture of what experts are calling ‘triple jeopardy’ – places where environmental damage, socio-economic struggle, and health challenges all overlap.
For the first time, local councils and health bodies have a clear, consistent map to see exactly where investment in parks, trees, and flood defences is needed most.
David Drake, Director for People and Nature at Natural England said: ‘Natural England’s expertise in green infrastructure, spatial data and nature-based solutions shaped how these tools were designed and what they measure.
‘Decision-makers now have something they haven’t had before: a consistent, high-resolution evidence base covering the whole of England that can tell us, at a glance, where environmental disadvantage is greatest so that we can take action.’
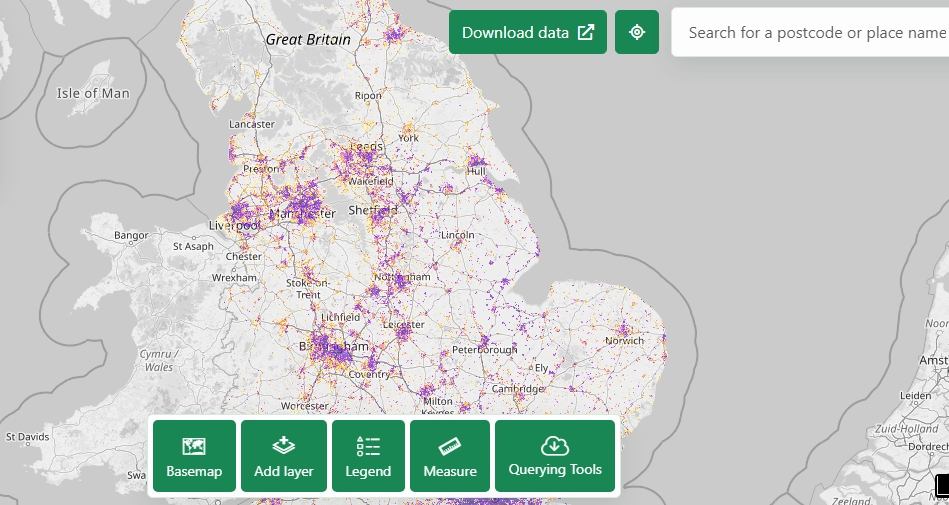
The project was piloted with local authorities to ensure it is practical and ready for immediate use. Both datasets are now available for free via the Natural England Green Infrastructure Mapping Tool.
Decision-makers are encouraged to look up the areas they work in, export the data, and use it to argue for new green investments. However, officials stress that these maps are the beginning, not the end. The best insights come when this high-tech data is combined with the local knowledge of the people who actually live in these communities.
Mike Childs, Head of Science, Policy and Research at Friends of the Earth said: ‘We’ve known for a long time that some communities are disproportionately affected by environmental harm and exposed on multiple fronts. So today’s launch, which sees these compounding threats tracked officially for the first time, is a significant step towards improving access to information and justice on the environment.
‘With these tools, communities and councils can gain a clear understanding of the main environmental risks locally, as well as which areas need to be prioritised for action. We know just how valuable resources like these are for delivering change at the local level thanks to our work with hundreds of local action groups up and down the country. This is a shining example of what collaboration between government, campaign groups and academia can unlock.’
Both tools are now freely available via Natural England’s Green Infrastructure Mapping Tool.