



















While scientists continue to debate whether the planet’s overall warming rate is accelerating, a new study takes a different approach by zooming in on the regional level to identify where warming has actually sped up since 1970 and when those shifts occurred.
Led by Claudie Beaulieu at UC Santa Cruz, researchers analysed five major global surface temperature datasets using a statistical technique called changepoint detection. This method identifies moments when a temperature trend shifts significantly, such as from slow warming to rapid warming, or even from cooling to warming.
The results reveal that warming accelerations are real but geographically scattered. Fewer than 10% of the grid cells analysed showed a detectable change in warming rate and these changes cluster in specific regions, mostly at mid-latitudes in the Northern Hemisphere. The timing varies widely, from the 1980s to the 2010s.
Seven regions stood out as showing consistent changes: the Gulf of Mexico and southeast Mexico, Bolivia, southeast China, the eastern Mediterranean, New Zealand, and the North Pacific.
Some accelerations were particularly dramatic. Southeast Mexico’s warming rate increased roughly tenfold after 2012. Southeast China saw about a fivefold jump after 2013. The eastern Mediterranean accelerated in the late 1980s, while New Zealand’s warming sped up in the 2000s.
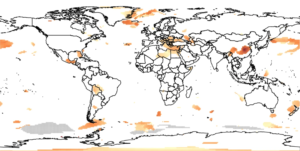
This map shows regions that exhibit changes in the rate of warming, highlighted in colors. Mid latitudes in the Northern Hemisphere are where changes are more prominent. Darker red indicates the most pronounced changes and is concentrated in southeast China.
The study also found that land and ocean behave differently. Over land, any changes almost always meant faster warming. Over the ocean, things weren’t so predictable. The Northern Hemisphere saw mostly accelerations, while the Southern Hemisphere experienced both speed-ups and slowdowns, particularly in the Southern Ocean during the 1980s.
The researchers suggest that reductions in aerosol pollution might be driving these regional shifts. Aerosols reflect sunlight and cool the planet and as countries like China and Mexico have cleaned up their air, that cooling effect has weakened, potentially unmasking faster warming. Natural climate patterns like the Pacific Decadal Oscillation may also play a role.
Lead author Claudie Beaulieu, associate professor of ocean sciences at UC Santa Cruz, said: ‘What we wanted to do is provide a clearer, region-by-region picture of where warming is actually accelerating – and when it began.
‘Our study shows that regional speed-ups have emerged in distinct waves, with onset timings ranging from the 1980s through the 2010s depending on the geographical area.’
One important consequence of faster warming is that what counts as an ‘extreme’ event can change. Even a steady rise in temperatures shifts the baseline for heatwaves and other extremes, but when the rate of warming increases, record-breaking temperatures can become much more likely.
The researchers say understanding where and when these changes in warming rates occur is important for assessing regional climate risks, planning adaptation measures and managing the environment. Areas with large populations and lower levels of socioeconomic development may be particularly vulnerable to rapid warming and more frequent or severe temperature extremes.
Ecosystems can also be especially sensitive to rapid changes in temperature, which may be more disruptive than a gradual increase.
Beaulieu said: ‘We hope that this work revealing when and where these accelerations have occurred in the past, along with an interactive public dashboard to enable the public to continue monitoring local rates of warming by clicking on a map, will provide tools and support to better anticipate localized impacts and target efforts where they are most needed.’
The full research can be read here.
Graphic: Beaulieu, C., Johnson, A., Killick, R. et al.
Photo: Javier Miranda