


With April showers increasingly turning into deluges, and storm overflows notoriously struggling with volume of water, a major new national project has marked which households need to be most worried.
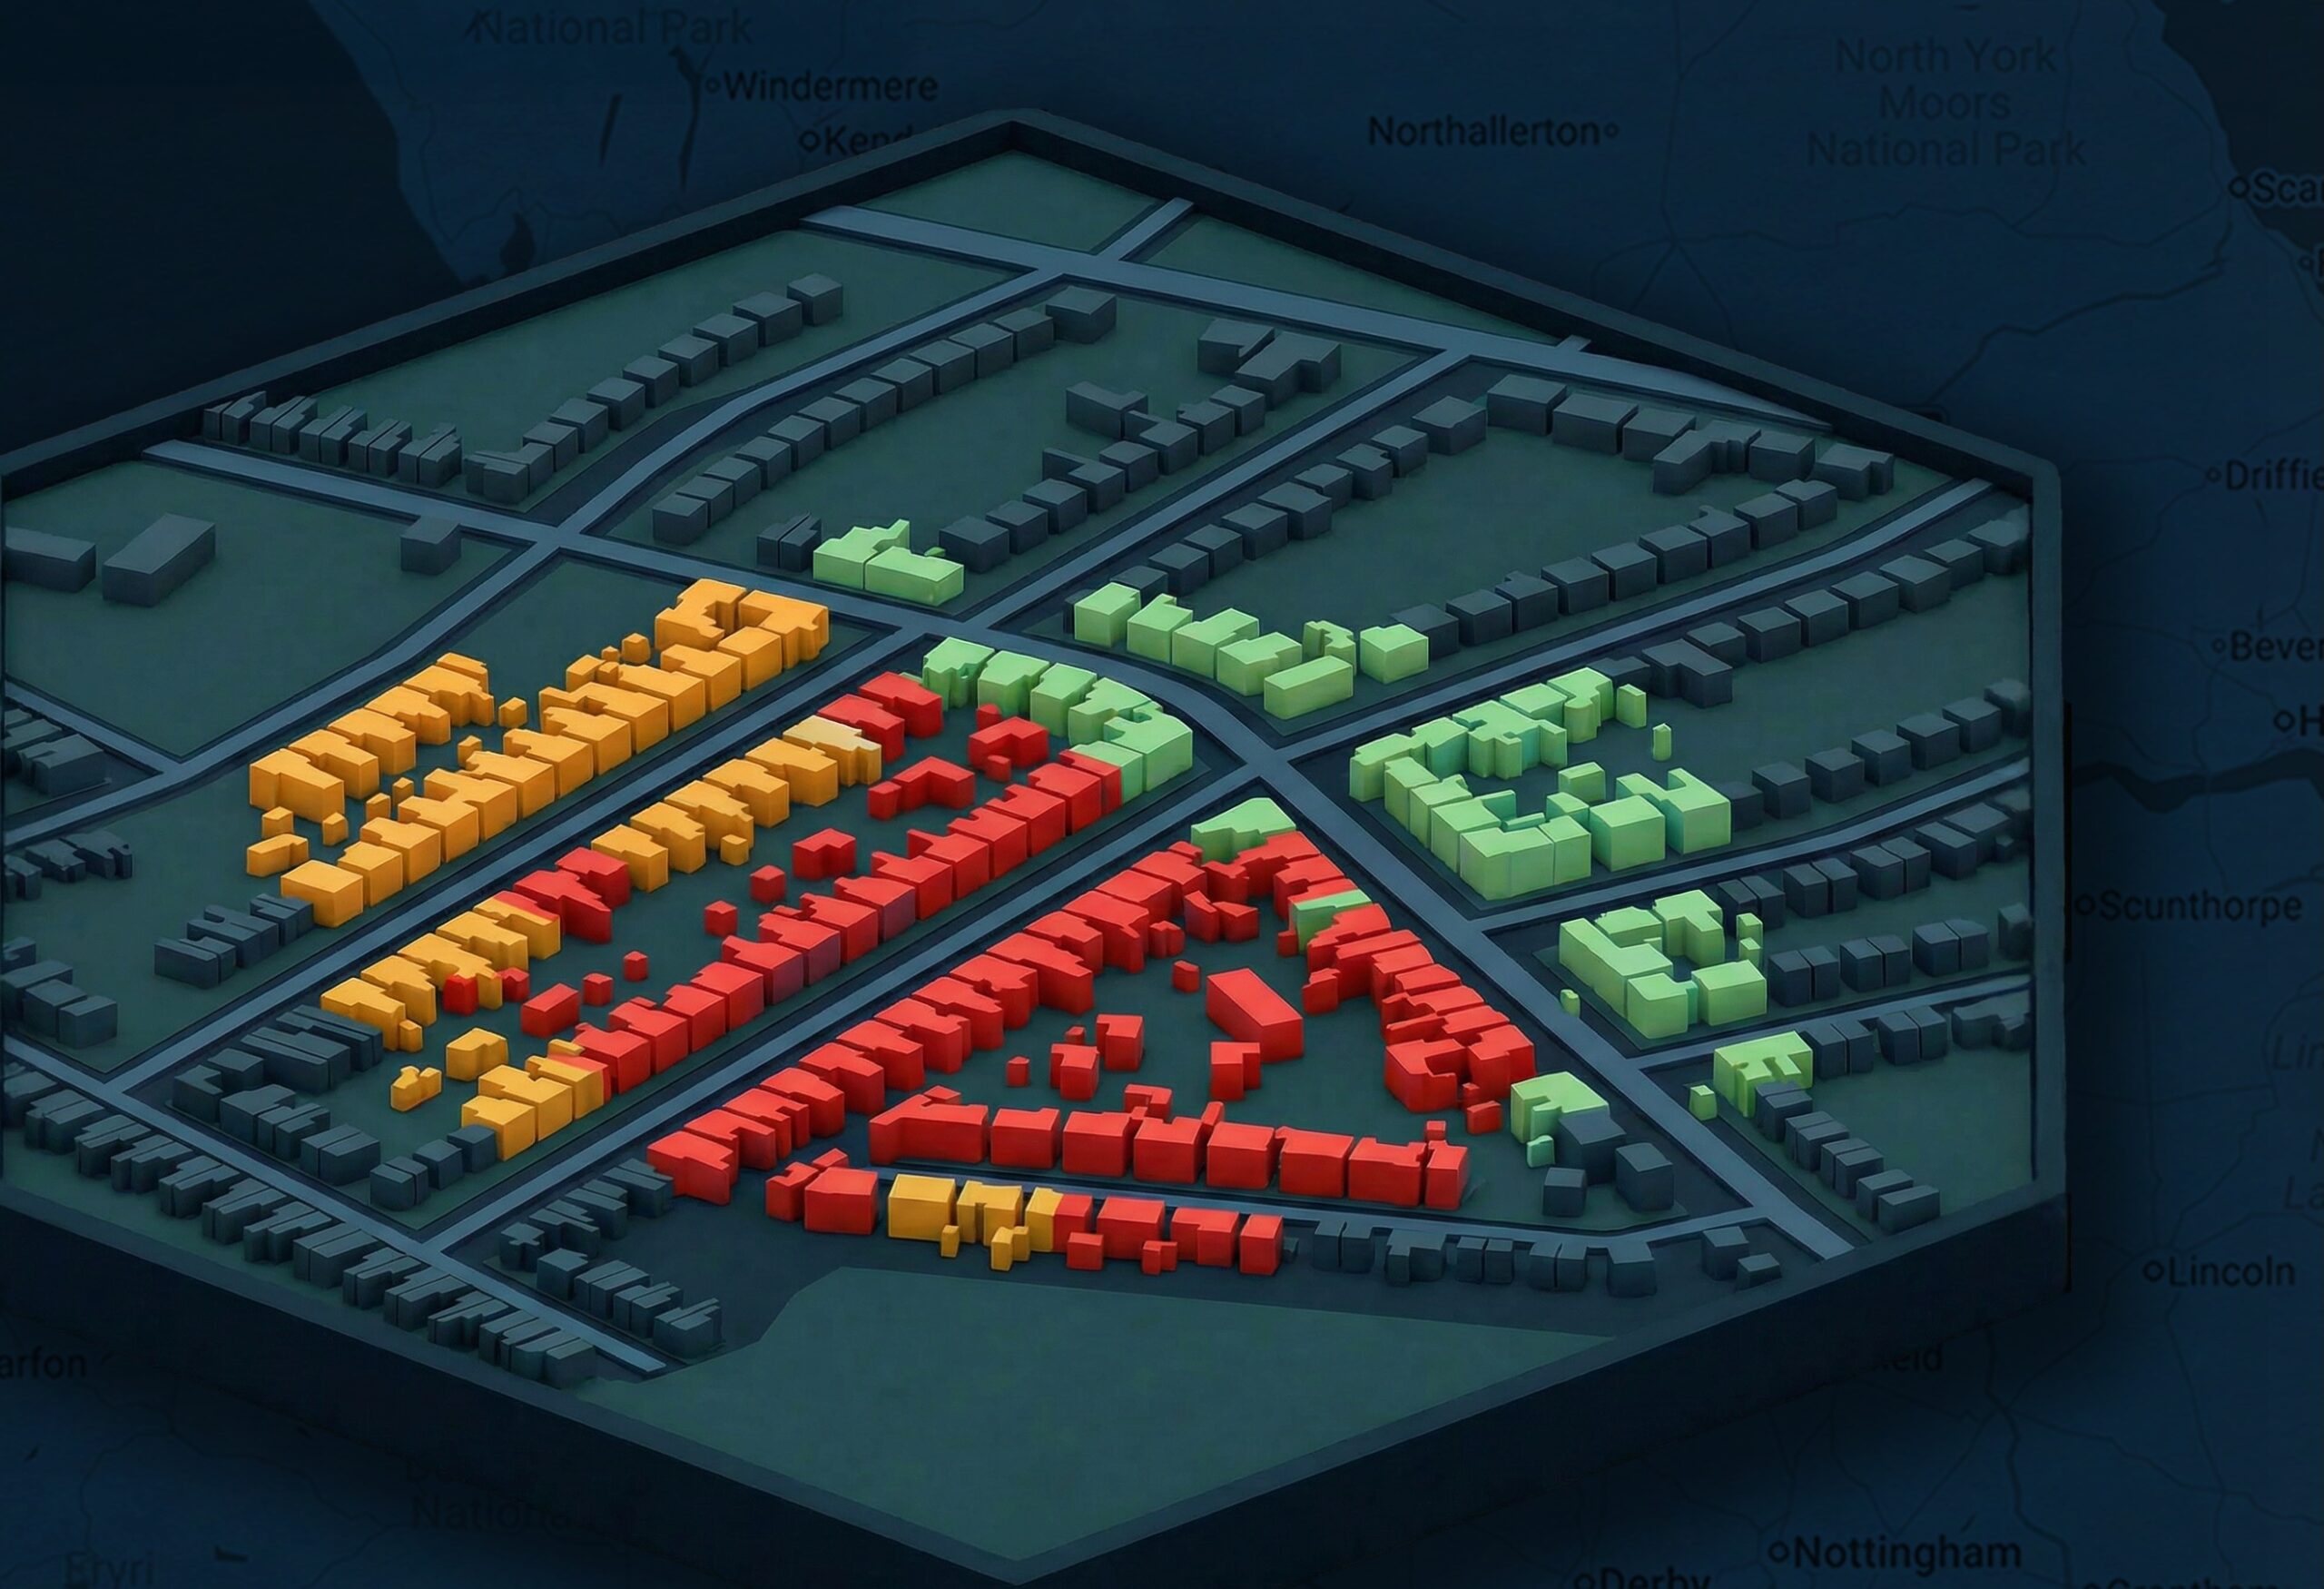
Conducted by Ordnance Survey, and powered with AI data cloud Snowflake, new modelling has shown 1.2 million homes which are susceptible to flooding across England. This first-of-its-kind research is available as part of the OS Intelligent Flood Readiness Model.
Using official historical data on flood prevalence and social deprivation, alongside 3,000 pages of Food Risk Management documentation produced by the government, the results offer the most granular insight into how the country’s properties can be impacted by flooding incidents.
Of the buildings which have been identified as susceptible, 68% are considered highly vulnerable to after-effects of flooding. This includes risks associated with deprivation and economic investment, with poorer areas often suffering from worse infrastructure and resources.
The vast majority — 84% — were also built before 2001, when legislation was updated to require flood risk being factored into planning permissions. 15% were constructed pre-1919 and almost one-quarter were added to housing stock before 1959.
‘Data is at the heart of making informed decisions,’ said Fawad Qureshi, Global Field CTO at Snowflake. ‘As this project shows, it’s rare that one body holds all the relevant data or that this data is in the same format. But we’re now in an era where technology can bring together the right people and the right data to collaborate on making better informed decisions.’
Based on this new mapping, areas on the east coast of Yorkshire and around the Humber River have the highest estimated concentration of undefended and vulnerable properties. This region was also identified as having the most road and rail routes which are highly exposed to flooding.
Looking at the national picture, residential addresses dominate, with just 15% of those identified classed as commercial, 10% industrial and 5% infrastructure. Worryingly, based on current approaches, available budgets and the spread of buildings, it would be almost impossible to protect all sites. In terms of English neighbourhoods, for example, two-fifths contain at least one at risk property. Meanwhile, surface water flooding represents the greatest threat, as oppose to river or coastal events.
‘By delivering geospatial intelligence difficult to derive manually, decision-makers can access data-driven, actionable insights — without the burden of analysing endless spreadsheets,’ said Tim Chilton, Managing Geospatial Consultant at Ordnance Survey. ‘The model maps vulnerable zones and identifies areas at greatest risk, helping local government shape policy, direct resources, and safeguard communities.’
A number of recommendations have now been made to policymakers. These include:
- Use the ability of models like these to analyse more granular data to move from treating wide, geographic areas as homogenous to factoring in neighbourhood or individual building vulnerabilities. This wouldn’t mean thousands of unique plans; policymakers could identify plans for period properties with basements, for example, and apply that protocol to areas where these properties are shown to exist.
- Understand where there are clusters of vulnerability, especially when these areas straddle arbitrary boundaries like local authorities or FRMP zones.
- Look at surface water infrastructure investment, with most properties at risk from surface water flooding, investment in unseen infrastructure, like better drainage, could pay dividends.
- Consider a vertical risk assessment, factoring the height of a building as well as their footprint and creating specific high-rise emergency protocols.
- Factor in social deprivation to plans, as this will influence how well an area can deal with and recover from the aftermath of flooding. Two areas could have very similar natural geography and buildings but very different levels of deprivation or wealth.
Image: Ordnance Survey / Snowflake
More on Biodiversity & Climate Change:
10 million trees have now transformed England’s industrial heartland
Spring means dandelions are in, chronic inflammatory diseases are out
Suffolk and Norfolk are case studies for nature based solutions investment